Analyzing WLAN Networks
Available Statistics
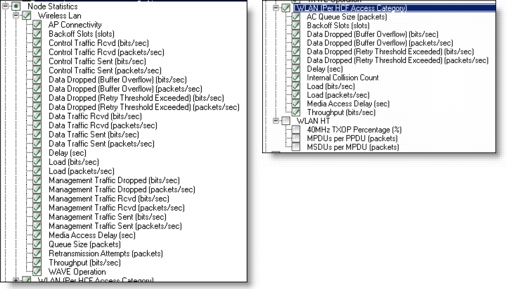
To analyze the performance of the WLAN protocol, several statistics can be collected during simulation execution. Statistics can be collected on a global, per-node, or a per-module basis.
Figure 672: WLAN Global Statistics
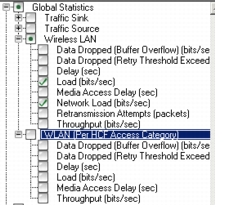
Figure 673: WLAN Node Statistics
Available Reports
When you have selected statistics for your network model, you can run DES and display the routes taken by configured demands. After running DES, select Protocols > IP > Demands > Display Routes for Configured Demands… (DES).
Figure 674: Display Routes for Configured Demands
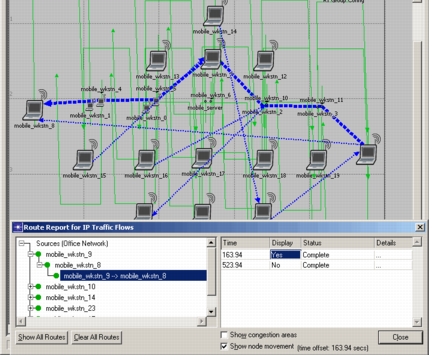
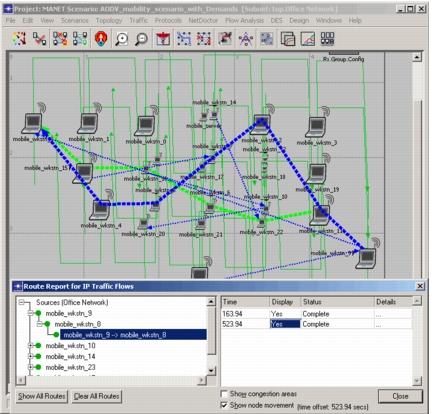
Expand a source in the left window and note the time points displayed in the right window. Change the value of Display to Yes to visualize the route taken. Additionally, if you select the “Show Node Movement” checkbox, you will see the node position in the model.
Figure 675: Show Node Movement
Visualizing Wireless LAN Configuration
You can visualize the connectivity in wireless LAN (WLAN) networks with 3D Network Visualizer. For more information, see “Visualizing Wireless LAN Connectivity in 3D Network Visualizer”.