Debugging/Simulation Tracing: TCP
The TCP model provides several simulation run-time tracing and debugging features. These include labeled traces and diagnostic block code execution when simulation is run under the control of OPNET simulation debugger (ODB).
The following table lists the various label traces that can be used while understanding the behavior of the TCP models:
Table 221: TCP Label Traces
| ODB Label | Description |
|---|---|
ecn |
Prints information related to the explicit congestion notification |
tcp |
Prints all protocol-specific information tracked by the TCP model. This includes sending connection open requests, data transfer, retransmissions, ACK handling, connection close, etc. This trace prints information across all managed connections |
tcp_buffers |
<Diagnostic: tcp_conn_v3> Prints the complete buffer dump of the following three TCP buffers: Unsent data buffer, Unacked data buffer, Reassembly/socket buffer. |
tcp_conn_id_<n> |
Tracks TCP activity for connection ID <n>. In order to determine the correct connection ID, use “prodiag” on the TCP manager process of a given node. Every TCP connection in Riverbed Modeler is assigned a connection identifier, which can be determined by setting the “TCP Connection Information” model attribute to “Print.” |
tcp_extensions |
Prints information related to TCP extensions modeling: Fast Retransmit/Fast Recovery, Selective ACKnowledgments, and Window Scaling across all managed connections |
tcp_ooo_list |
<Diagnostic: tcp_conn_v3> Prints information about the out-of-order packets received |
tcp_retransmissions |
Prints information related to TCP retransmissions. This trace comes in handy when you want to accurately determine the event at which a retransmission occurs to understand the subsequent actions taken by TCP |
tcp_scps |
Tracks activity related to the SCPS-TP extensions for TCP |
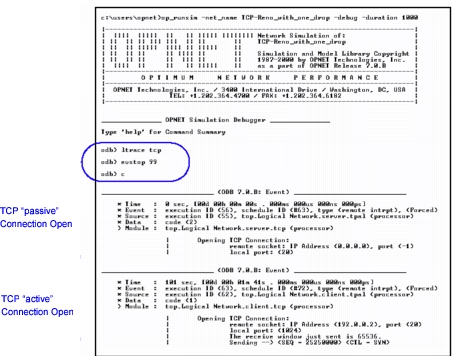
The following section illustrates how you can navigate through the different debugging/tracing features available in the TCP model. It assumes that you have enabled the “debug” option for a simulation containing TCP elements:
Figure 564: OPNET Simulation Debugger
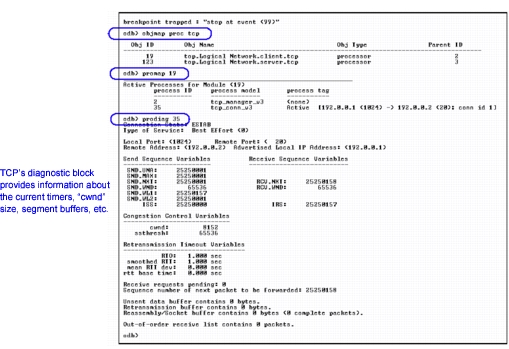
You can track the exact state of a TCP connection by using the following steps:
- Determine the list of “tcp” modules. For the object (i.e., node) of interest, determine the object ID of the “tcp” module
- Find a list of processes running within that module: You will notice that there is always one “tcp_manager_v3” and one or more “tcp_conn_v3” processes running under this module
- For the connection process of interest, print the diagnostic block contents.
The following example shows how to obtain the above-mentioned information.
Figure 565: Debugger Output
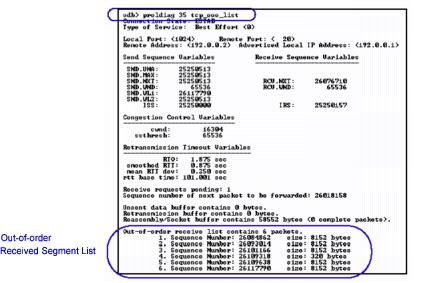
A special label “tcp_ooo_list” is available within the context of the diagnostic block to print information about segments that are received out-of-order.
Figure 566: Out-of-Order List