Available Statistics: TCP
To analyze TCP protocol performance, there are several statistics that can be collected during simulation execution. The statistics can be collected on a per-TCP connection, per-node or a global basis.
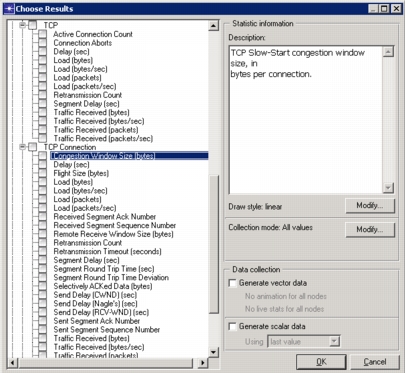
- Connection-based TCP statistics, grouped under the heading “TCP Connection”, are useful for studying low-level TCP performance metrics (for example, the “Congestion Window” maintained at each connection process can be probed).
- Node-based (and global) statistics provide grouped information for all TCP processes running in a node (and network) collectively. These are useful to determine the total flow of traffic traversing through the TCP Interface or the average TCP Interface delayed experienced by segments submitted by the application processes.
Note: To properly analyze TCP connection sequence and ACK numbers, delays, and windows, you must collect all available values during the simulation by setting the simulation capture mode to “All Values.” For help with this topic, see Setting a Statistic’s Capture Mode Procedure 165.
Figure 549: Selecting Statistics to Collect
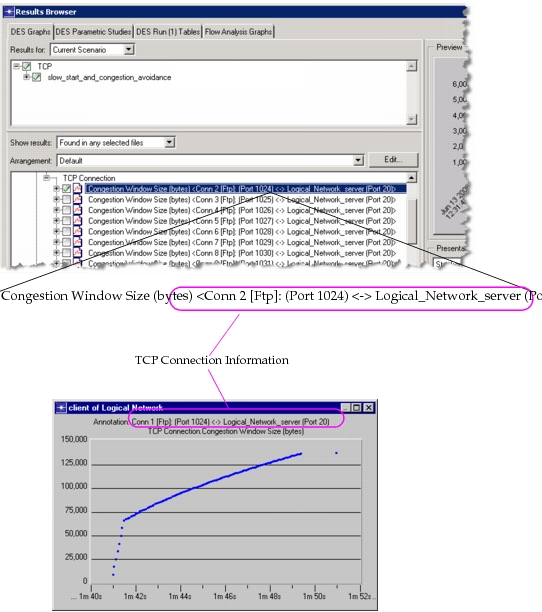
During simulation execution, the different statistics grouped under “TCP Connection” are annotated with information related to the connection for which the statistics is being recorded:
Figure 550: Viewing Statistics
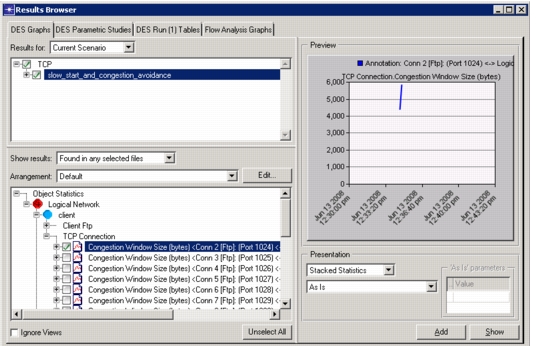
The “View Results” option from the project work space provides a listing of statistics that can be plotted—each “TCP Connection”-related statistics contains the “socket” information (i.e., local port, remote port, and remote address) as shown in the following figure.
Figure 551: TCP Connection-Related Statistics