Viewing a File’s Packet Count Histogram
You can display a histogram of the number of packets being sent or recorded by the Logger. When you load a file with the Data View enabled, the Logger calculates the histogram values for the entire file. Then it displays them (Figure 130). When you record a simulation with the Data View enabled, the Logger updates the Data View as data is recorded (Figure 141).
Figure 141: Data View in record mode
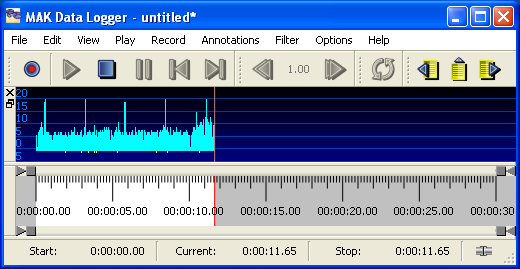
In the Data View, blue lines (above the centerline) represent the number of object packets; yellow lines (below the centerline) represent the number of interaction packets; red lines (small tick marks along the centerline) represent checkpoints.
Note: Since the Logger updates the Data View when it loads a file, loading large files with the Data View visible will increase load time considerably.
The Data View is completely updated each time you edit a file.
To show or hide the Data View histogram, choose View > Data View.