Visualizing ZigBee Behavior
The model includes two visualization features that you can use to analyze ZigBee networks. Both operations are available from the Protocols > ZigBee menu after you have run a discrete event simulation.
Visualize Tree Structure
This operation displays the structure of the ZigBee tree in the workspace.
Procedure 125: Displaying the ZigBee Tree in the Workspace
-
Configure and run a discrete event simulation. You can specify the time(s) at which you want to collect tree information in the Report Snapshot Time attribute (for more information, see Procedure 124).
-
Choose Protocols > ZigBee > Visualize Tree Structure.
Result: The Visualize ZigBee Tree dialog box appears. It lists the simulation times for which tree data is available.
-
If multiple times are listed, set the Display value to Yes for the simulation time that you want to view.
-
Click Visualize to display the tree in the workspace.
Note: You can repeat step 3 and step 4 to view the tree at other times, if available.
-
When you are done, click Close.
End of Procedure 125
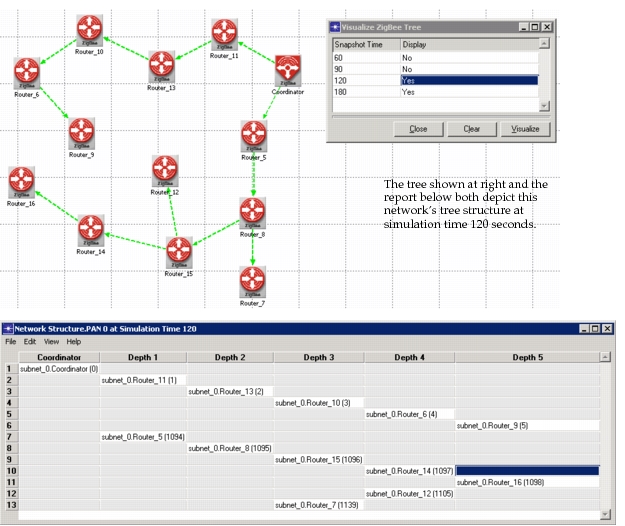
The following figure shows the ZigBee tree structure at 120 seconds. Also shown is the Network Structure report for the same simulation time. You can compare the representation of the tree in the workspace with the information in the report to confirm that they depict the same tree.
Figure 683: Visualizing the ZigBee Tree in the Workspace
Display Route From Selected Node
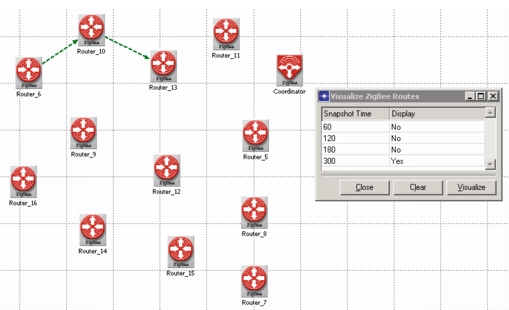
This operation displays the route for the currently selected node to its traffic destination based on the results of the most recent simulation. This feature applies only to networks that have mesh routing enabled.
Procedure 126: Displaying the ZigBee Tree in the Workspace
-
Configure and run a discrete event simulation. You can specify the time(s) at which you want to collect tree information in the Report Snapshot Time attribute (for more information, see Procedure 124).
-
In the workspace, select the node whose route you want to view.
-
Choose Protocols > ZigBee > Visualize Route for Selected Node.
Result: The Visualize ZigBee Routes dialog box appears. It lists the simulation times for which route data is available. You can also access this dialog box by right-clicking on the node and selecting Display Route to Destination.
-
If multiple times are listed, set the Display value to Yes for the simulation time that you want to view.
-
Click Visualize to display the route in the workspace.
Note: You can repeat step 3 and step 4 to view the tree at other times, if available.
-
When you are done, click Close.
End of Procedure 126
Figure 684: Viewing a Route in a ZigBee Network