QuickGraphs
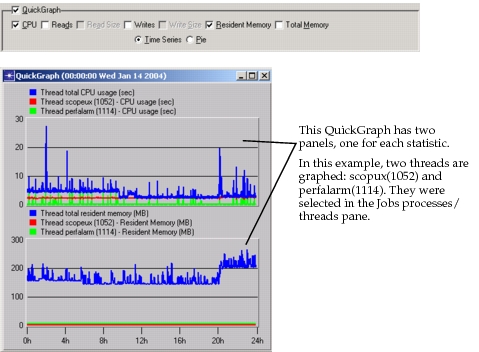
Quickgraphs display the data for the selected processes/threads as line graphs or pie charts. You can view QuickGraphs of the following statistics:
- Total CPU usage
- Total number of reads
- Average read size
- Total number of writes
- Average write size
- Average resident memory
- Average total memory
You can select more than one statistic at a time. When multiple statistics are selected, they appear stacked in the QuickGraph window.
You can view graphs of multiple processes/threads at a time. When multiple processes/threads are selected, they appear overlaid in a single graph panel.
Figure 5: Time Series Quick Graph