Analyzing MANET Network Models
Available Statistics
The following sections describe the available statistics for MANET-related protocols.
AODV
To analyze AODV protocol performance, several statistics can be collected during simulation execution. The statistics can be collected on a per-node or global basis. On MANET station node models, raw application packet statistics can also be collected on a per-node or global basis.
Global Statistics
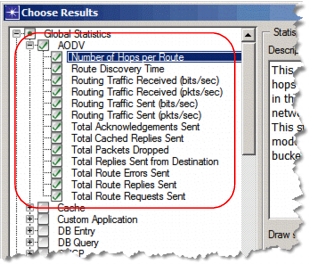
The global statistics are shown in the following figure. Global statistics allow you to examine network behavior for the entire model. For example, you can see the Total Route Errors Sent for the entire network.
Figure 369: AODV Global Statistics
Node Statistics
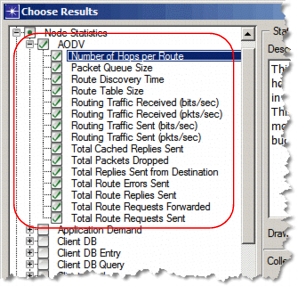
The node statistics are shown below. When you examine statistics on a per-node basis, you can see a statistic value (Total Route Errors Sent, for example) for a specific node.
Figure 370: AODV Node Statistics
DSR
Dynamic Source Routing functionality provides global and node statistics for analyzing DSR performance.
Global Statistics
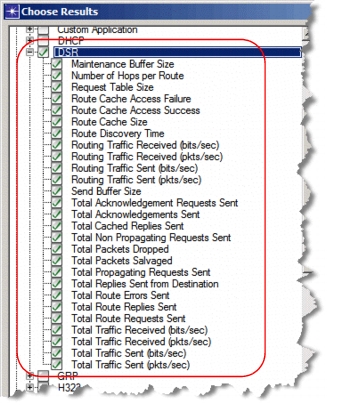
The global statistics are shown in the following figure. Global statistics allow you to examine network behavior for the entire model.
Figure 371: DSR Global Statistics
Node Statistics
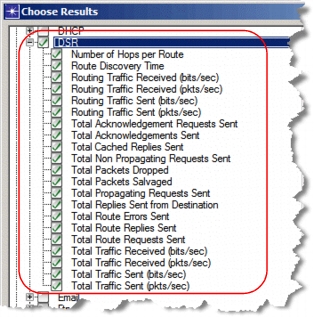
The node statistics are shown in the following figure. Node statistics allow you to examine DSR activity on a specific node.
Figure 372: DSR Node Statistics
GRP
Geographic Routing Protocol functionality provides global and node statistics for analyzing GRP performance.
Global Statistics
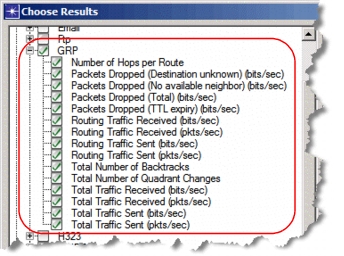
The global statistics are shown in the following figure. Global statistics allow you to examine network behavior for the entire model.
Figure 373: GRP Global Statistics
Node Statistics
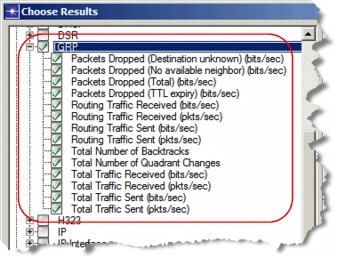
The node statistics are shown in the following figure. Node statistics allow you to examine GRP activity on a specific node.
Figure 374: GRP Node Statistics
OLSR
Optimized Link State Routing functionality provides global and node statistics for analyzing OLSR performance.
Global Statistics
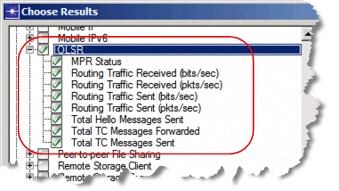
The global statistics are shown in the following figure. Global statistics allow you to examine network behavior for the entire model.
Figure 375: OLSR Global Statistics
Node Statistics
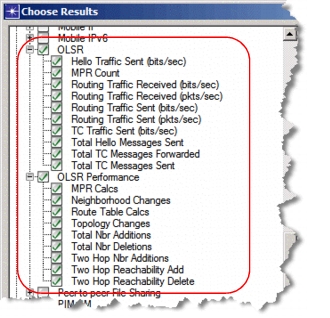
The node statistics are shown in the following figure. Node statistics allow you to examine OLSR activity on a specific node.
Figure 376: OLSR Node Statistics
TORA
Temporally Ordered Routing Algorithm functionality provides global and node statistics for analyzing TORA performance.
Global Statistics
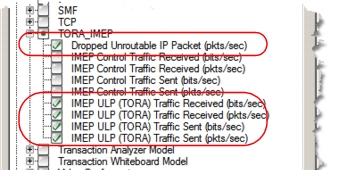
The global statistics are shown in the following figure. Global statistics allow you to examine network behavior for the entire model.
Figure 377: TORA Global Statistics
Node Statistics
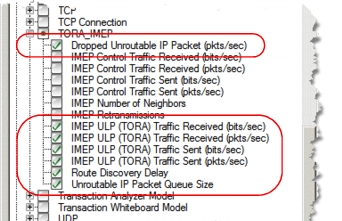
The node statistics are shown in the following figure. Node statistics allow you to examine TORA activity on a specific node.
Figure 378: TORA Node Statistics
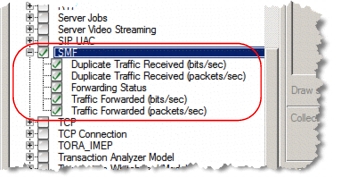
SMF
Simplified Multicast Forwarding functionality provides global and node statistics for analyzing SMF performance.
Global Statistics
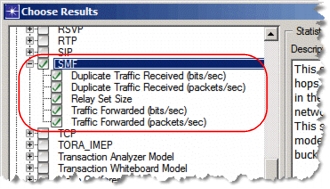
The global statistics are shown in the following figure. Global statistics allow you to examine network behavior for the entire model.
Figure 379: SMF Global Statistics
Node Statistics
The node statistics are shown in the following figure. Node statistics allow you to examine SMF activity on a specific node.
Figure 380: SMF Node Statistics
Available Reports
DES
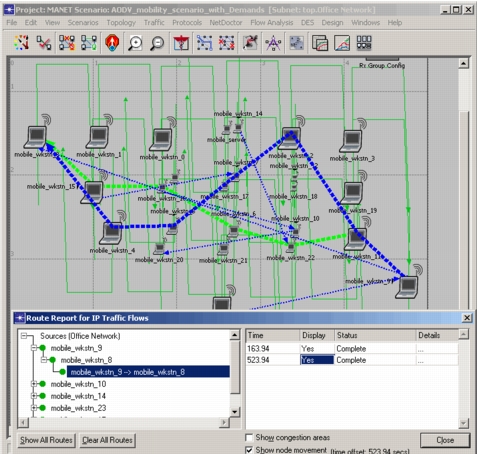
When you have selected statistics for your network model, you can run DES and display the routes taken by configured demands. After running DES, select Protocols > IP > Demands > Display Routes for Configured Demands… (DES).
Figure 381: Display Routes for Configured Demands
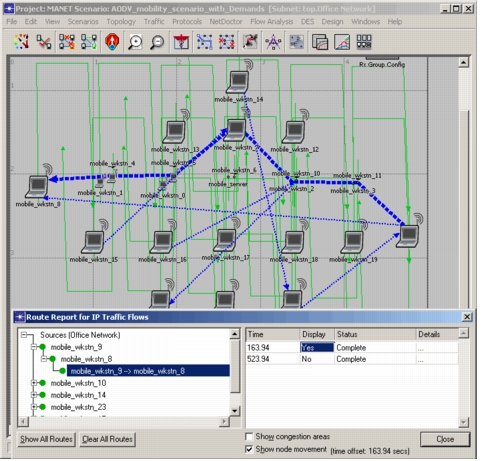
Expand a source in the left window and note the time points displayed in the right window. Change the value of Display to Yes to visualize the route taken. Additionally, if you select the “Show Node Movement” checkbox, you will see the node positions corresponding to the time point. The node position corresponds to the time point against a row whose route display is changed to YES.
Figure 382: Show Node Movement