Available Statistics
To analyze Server performance, you can collect several statistics during simulation execution. The statistics are collected on a per-node basis, and are reported under three different statistic groups:
-
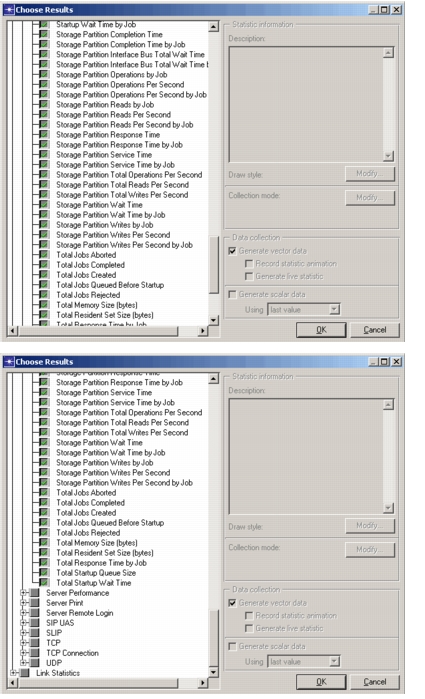
Server Jobs
-
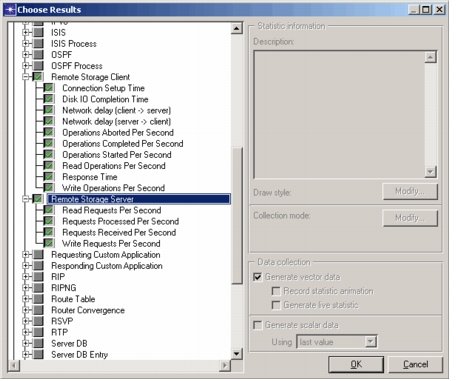
Remote Storage Client
-
Remote Storage Server
-
Statistic group – Server Jobs: Node-based statistics provide grouped information for all Server processes running in a node. These are useful to evaluate hardware and software bottlenecks within a server or within a network. Many statistics are available on a job-specific basis as well as on a server-wide basis. The statistics in this group can be further classified as pertaining to the following:
- CPU statistics – provides information of Total CPU utilization, CPU Partition utilization, and individual CPU utilization for the “Simple CPU.” Also provides the breakdown of the amount of time the job spent in the CPU subsystem. The CPU completion time should be the sum of the CPU service time and the CPU wait time. Also reported is the job queue length for each CPU Partition and number of job instances of each type in the queue. Higher job queue sizes lead to higher CPU wait times increasing the CPU completion time of jobs.
Note: When the Specialized Server Models (SSM) are used, a detailed breakdown of the server's CPU utilization are reported by the statistic “CPU Utilization (%)” under the group “Server Jobs”. In this case, the “Simple CPU” is still used and the former statistic (CPU > Utilization (%) accounts for the IP packet forwarding delays and application processing delays.
-
Storage Partition statistics – provides information about the amount of time the job spent for completing their IO requirements and provides a breakup of these delays. Also reported are the number of operations (reads/writes) received by each storage partition.
Note: The storage partition statistics include Storage Partition Completion Time and Storage Partition Response Time. The response time is the amount of time the job had to wait for getting an IO completion indication, and the completion time is the wall clock time for the IO to actually complete. The response time could be less than the completion time, for example in case of cached writes.
-
Disk statistics - provides information about the number of operations (reads/writes) received by disks, the disk queue lengths, and the resulting disk utilizations.
-
Disk Interface and Interface Channel statistics - provide information about the disk interface and interface channel queue lengths, and the resulting utilizations.
-
Replication statistics - provides information about the number of replication operations started, the number that completed successfully and the number that were aborted.
-
System statistics - provides information about the number of active jobs, their total completion time (which should be the sum of CPU completion time and Storage Partition response (or completion) time), the number of jobs that were aborted, total number of page faults (both soft and hard), the memory usage, and so on.
Figure 521: Available Statistics (Server Jobs)—1 of 2
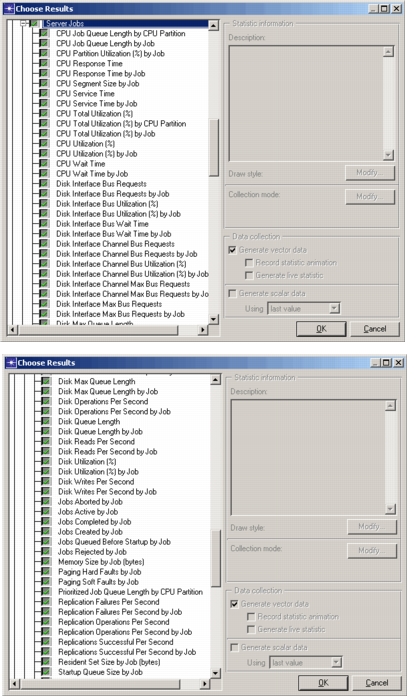
Figure 522: Available Statistics (Server Jobs)—2 of 2
- Statistic group - Remote Storage Client: Provide information about the number of remote access requests sent, how many of them were reads and how many were writes. The number of operations that completed successfully and the number that were aborted. The most important statistics that this group provides is the break-up of delays. The response time as observed by the client is the sum of the connection setup time, the network delay of sending the request from the client to the server, the disk IO completion time and the network delay of sending the response back from the server to the client.
- Statistic group - Remote Storage Server: Provide information about the number of remote access requests received, how many of them were reads and how many were writes. The number of requests that were processed successfully.
Figure 523: Remote Storage Server Statistics
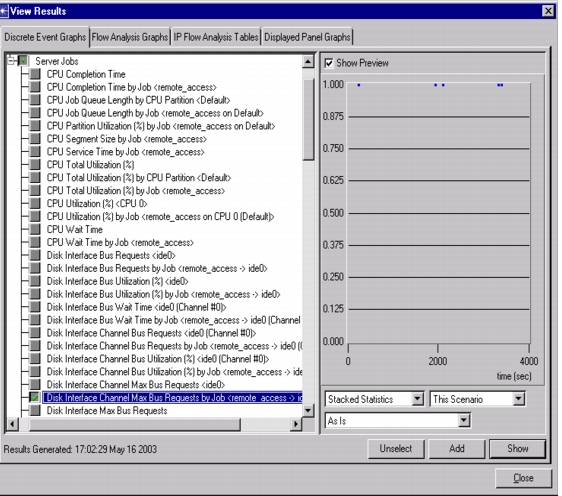
When viewing results, the per-job statistics are annotated to indicate the job they apply to, similarly the statistics that are related to the storage partitions, disk, disk interface, CPU partitions are annotated by the storage partition name, disk name, disk interface name, CPU partition name respectively. In case of statistics related to the disk interface channels, the statistics are annotated by the disk interface name and the interface channel index.
Figure 524: Statistics with Annotations