Statistic Animation Features
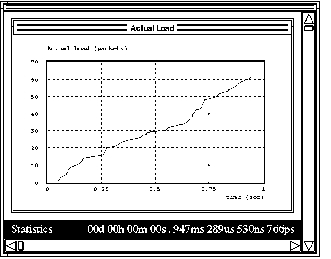
Statistic animation is presented in op_vuanim as graphs of simulation statistics. These plots resemble the analysis panels used in the Analysis Tool, except that they plot the output vector results as the simulation generates them. You can graphically display an output vector result being graphed by specifying a value for the “statistic” attribute of statistic animation probes.
Figure 31: Statistic Panel and Viewer