Automatic Animation Features
Automatic animation probes can be set on subnets, nodes, and modules to generate an animation representation. There are three types of representations: node movement, packet flows, and state tracking. These are summarized in the following table.
Table 18: Automatic Animation Representations
| Representation | Object(s) Being Probed | Description |
|---|---|---|
| node movement | subnetworks | Displays the movement of mobile and satellite nodes within a subnetwork. |
| packet flows | subnetworks, nodes (fixed, mobile, and satellite) | Displays packets being sent over point-to-point links, bus links, and bus taps within a subnetwork; displays packets being sent over packet streams within a node. |
| state tracking | processors, queues | Displays the active state of the root process of a processor or queue module. |
Node Movement Representation
If an automatic animation probe is set on a subnetwork, the node movement representation can be selected. This representation displays the movements of nodes within the selected subnet. The application of this representation is viewing the movement of mobile and satellite nodes along trajectories and orbits. Fixed nodes are displayed, but do not move in this representation. Figure 26 provides an example of how node movement animation will appear within op_vuanim. In this example, an automatic animation probe has been placed on the “mrt_sub” subnet. The animation shows the movement of the “jam” mobile node along its trajectory. The diagrams show the animation of node movement at two different simulation times.
Figure 26: Example of Node Movement Representation
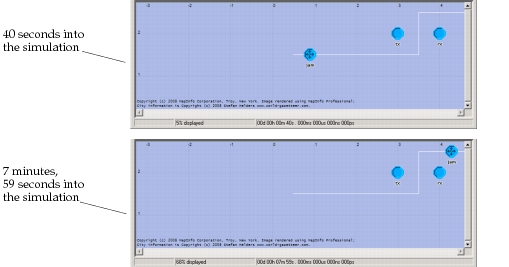
You can also set the packet flows or the packets flows and node movement (shown as pk flows & nd mvmt) representations on a subnet.
Packet Flows Representation
If an automatic animation probe is set on a subnetwork or a node, the packet flows representation can be selected. This representation displays packets being sent over certain types of paths: point-to-point links or bus taps in a subnetwork, or streams in a node (note that bus packet flows are displayed on the bus taps, not the bus links themselves). Packets are represented by traversal marks, which appear as yellow dots moving along the paths (note that all colors mentioned in this section will appear as black on monochrome monitors). The animation viewer displays, in blue text on the screen, the ID numbers of the packets in the packet flow. Once a packet has traversed a path, a small red arrow indicating the flow direction is permanently displayed near the middle of the path. Such arrows are useful for visually determining which paths have been traversed.
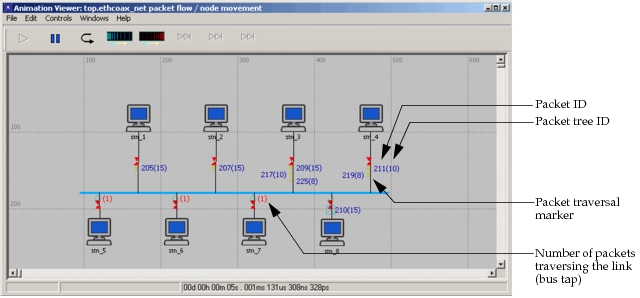
There are several variations in the identification of packets in the packet flows representation. On point-to-point links or streams, a packet traversal mark is identified by its associated packet ID, displayed near the mark as a yellow number (a packet ID is a serial number that uniquely identifies a packet within a simulation). Depending on the angle of the path, a packet's traversal mark and ID number may be visually tied by a short yellow line segment. On bus taps, a packet traversal mark is identified by both its associated packet ID and its packet tree ID displayed near the mark as two adjacent yellow numbers (the packet tree ID is the right-most number of the two, and it is surrounded by parentheses). A packet tree ID is a serial number that uniquely identifies a “tree” of packets that are all copies of a single original packet; packet trees are only created when new packets are created, but not when packets are copied). If paths are very short, there is not enough space to display packet traversal marks. If packets are sent on such paths, a red number surrounded by parentheses is displayed on the path, representing the quantity of packets currently traversing the path. This quantity is distinguishable from other IDs by its red color, surrounding parentheses, and the lack of an adjacent packet traversal mark.
Packet traversal marks (and their identifying numbers) represent packets being sent over paths. The animation intervals in which packet traversal marks are displayed correspond to the intervals in which the represented packets were undergoing transmission. The animation of the marks consists of two major steps: (1) to represent a packet beginning transmission, the corresponding mark appears at the source end of the path and moves to a resting point near the middle of the path; (2) to represent a packet ending transmission, the corresponding mark moves from the middle of the path to the destination end of the path, and disappears.
When packet transmission happens over a short time span, the two animation steps of a packet traversal mark may be immediately consecutive in an animation, and thus visually merge so that it seems the traversal mark did not stay at the resting point near the middle of the path at all. In addition, under some conditions packet traversal marks undergo a compressed, one-step animation in which the mark moves along the whole path without resting; this occurs on streams with the forced delivery method.
If more than one packet is being sent on a path at the same time, multiple packet traversal marks “stack up” near the middle of the path, on the half of the path closer to source object. The stack of marks on the path builds in order of arrival, towards the source object. The possibility of multiple traversal marks appearing on a single path depends on the type of path, as described in the points below:
- Point-to-point links and bus taps can have multiple channels, and the packet flows representation merges the packets of all channels of a path without specifically identifying them with their channel. Thus multiple packet traversal marks may appear concurrently on a multi-channel link or tap, representing packets on different channels.
- Even on single-channel point-to-point links, multiple packet traversal marks may appear concurrently. If a packet begins transmission at the exact time that another packet ends transmission, the traversal marks for both packets will appear together just at the time of transition.
- Duplex point-to-point links and bus taps are bi-directional, so packets being received and transmitted are both represented, on opposite sides of the path's middle.
- The reception of multiple concurrent packets on a single channel of a bus tap is not represented by multiple packet traversal marks; instead, the collision is represented by a red box with an inscribed “X” that appears over the first packet's traversal mark just before that mark is erased.
- Multiple traversal marks can appear on packet streams in nodes if the packets are sent with the scheduled delivery method, and there is either a delivery delay or multiple packets are forwarded over the same stream at the same time.
The following diagram illustrates the packet flows representation in a bus-based network.
Figure 27: Example of Packet Flows Representation
State Tracking Representation
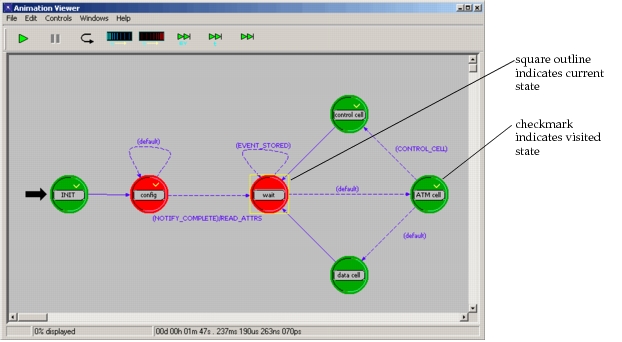
If an automatic animation probe is set on a processor or queue, the state tracking representation can be selected. This representation displays the diagram of the root process inside the processor or queue being probed. A square outline appears around the initial state, and moves from one state to the next as the root process is interrupted and responds by executing actions and choosing transitions. This animation allows users to gain a better understanding of the process model and external condition dynamics. The following example shows the state tracking of a process model at two different simulation times.
Figure 28: Example of State Tracking Representation