Configuring Unicenter NSM Systems in Windows
The Performance Agents supplied with Unicenter NSM Systems Performance can collect a wide range of Systems Performance data from a heterogeneous set of platforms. By default, the Performance Agents are configured to collect a typical set of useful metrics that can be analyzed directly using the Performance Trend and Performance Scope applications. The following steps describe how to configure a Windows 2003 machine profile. Similar steps can be used to create Unix profiles.
To use the Performance Agents to collect the data, the following additional configuration steps may be needed.
- Set the data collection frequency to 5 or 10 minutes
- Make sure that Thread metrics are not collected by the Performance Agent
- Collect other needed (see Required Metrics)
- Configure the Performance Cubes for delivery back to the management station
The steps required to configure the Performance Agent with these changes are described in the following procedure.
Procedure 30: Setting Up CA Unicenter NSM for Import with the SPCA
-
Launch Performance Configuration.
-
Navigate to the Profiles section of the UI and double-click on the profile you want to set up or create a new profile.
-
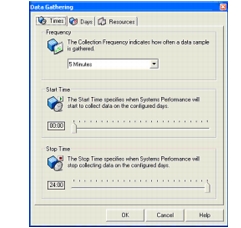
When the profile has opened, navigate to the Data Gathering node and right-click on the node. On the Times tab, select Modify… and set the data collection frequency to 5 Minutes or 10 Minutes.
-
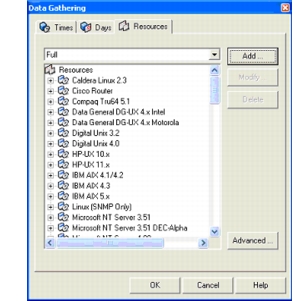
On the Resources Tab, click the Add… button to add a new custom resource set.
-
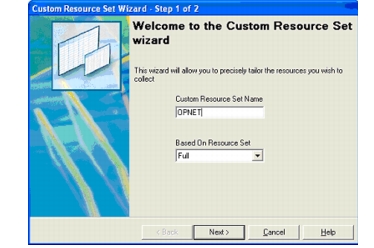
Create a new custom resource set based on the “Full” Resource Set.
-
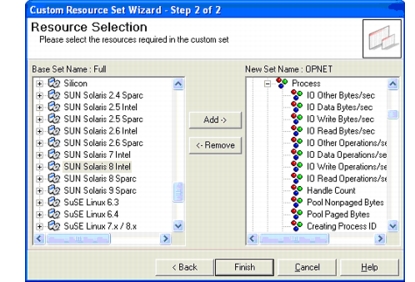
On the Second page of the Custom Resource Set select the metrics needed for import into Server Characterization Editor. The required metric for each platform are listed in the Required Metrics section.
-
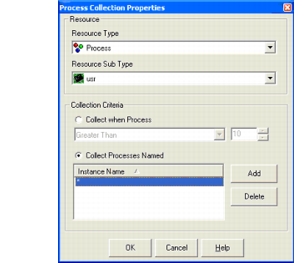
Configure the Performance Agent to collect all instances of the processes for the selected metrics.
7.1 Select the Advanced… button from the Data Gathering property page. 7.2 Click the Add… button and add in data collection of “Named Instance” and “*” for each of the process metrics.
-
Configure the performance agent to deliver the created Performance Cubes back to the manager station where they can be converted to CSV files for import into Riverbed Modeler.
8.1 Navigate to Data Management > Daily Cubes > Full Daily Cube and click Modify.
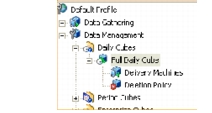
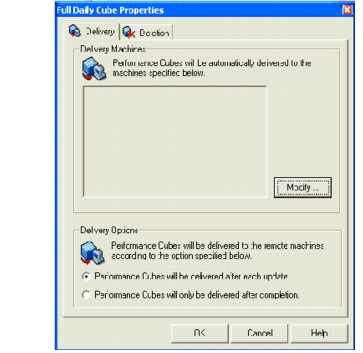
8.2 On the Delivery Machines tab, click Modify… Select the manager machine from the list of available machines. Optionally, you can opt to deliver the cube “on completion”.
-
Exit the profile and return to the main Performance Configuration UI.
-
From the Performance Configuration UI you can drag and drop the profile to the machine you want to model using Riverbed Modeler.
Once configured, the NSM Systems Performance Agent automatically collects the performance data in Cube (.pcm) format. If the default options are used, performance data will be saved for 45 days. The default location of the cube repository on Windows systems is C:\NSM\PERFDATA\performance_cubes.