3D Network Visualizer Animation Components
Every 3D Network Visualizer animation is based on a network scenario in Modeler. This section describes the following components of a 3D animation, and how they relate to the corresponding Modeler scenario:
Entities, Aggregates, and 3D Models
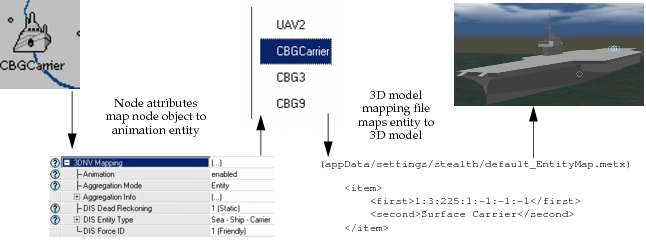
In the context of 3D Network Visualizer, an entity is an animation element that represents a concrete object in the network. Examples of entities include planes, helicopters, ships, and trucks. Every entity in a 3D animation corresponds to a node in the corresponding Modeler scenario. To map a node to an entity, you configure attributes on the node.
You can group entities into aggregates; an aggregate is a collection of entities, aggregates, or both that acts as one entity (that is, it appears as one object in 3D Network Visualizer). This concept corresponds roughly to subnetwork objects in Modeler, since a subnetwork acts as a container for nodes and other subnetworks.
3D Network Visualizer includes a library of detailed 3D models for visualizing entities and aggregates in 3D Network Visualizer. A specified 3D model mapping (*.metx) file defines how entities map to 3D models. You can edit 3D model mapping files to customize the relationships between entity types and specific 3D model files. You can also include 3D models developed by third-party developers.
Figure 37: Mapping Nodes to 3D Animation Objects: Example
Terrain
3D Network Visualizer provides a realistic display using terrain and moving-model geometry in the MultiGen-Paradigm OpenFlight format, and includes several terrain sample databases such as Hunter-Ligget, Monterey, and Berkeley.
Decorations
In addition to entities and terrain, a 3D animation can include several types of decorations that are used to show information about the network. 3D Network Visualizer can show decorations such as entity names and trajectory histories.
The Standard Model Library includes a set of 3D animation configuration objects, which you can use to add specific types of decorations to the resulting animation. Examples of useful decorations include:
- Lines between nodes to represent packet transmissions
- Spheres or other shapes to represent transmitter ranges
- Numbers that show simulation results (such as the number of packets received by a node)
3D Network Visualizer includes the Ovis API, which you can use to create custom decorations that visualize information of interest from the network scenario and simulation results: protocol configurations, traffic information, packet transmission patterns, wireless communication effects, and so on.